Demonstrating the Magic Clusters: How to Save Money by Clustering Your Parts
✨ There is a magic combination that exists in your parts data. If you take a category of parts that are all described by the same attribute characteristics and combine them with commercial data - pricing, supplier, plants and volumes - you get magic!
It's amazing some of the things you can do when you cluster your data. You can see a lot of interesting things especially if you are clustering data from different business groups that have worked independently of each other. Here are some important considerations to keep in mind as you get started. 💡
❇️ Classify your parts first
It all starts with classifying your parts into categories:
- First, group similar parts from across your organization.
- Once grouped, you will need to enrich them with valuable attribute data.
- Next, determine the most important attributes for the parts you are clustering -- we call those key attributes. It’s the critical attributes you would use to find the part you need. Key attributes must have good fill rates and be normalized before you can cluster. 🔑
🛣️ Clustering Process
Once your parts are classified - you can now begin to cluster them:
- Start by weighting your key attributes then set your neighbor distance - this is like a proximity to duplicates factor. In other words, the smaller the neighbor distance, the more related the items will be in your cluster.
- Iterate the neighbor distance to find the clusters you desire.
- Once you are done your clusters, they should look like the chart below:

Example of a Cluster of Circuit Breakers - Similar Key Attributes with Different Pricing
🎚️ Weighting Clusters
We produced the cluster in the chart above by assigning a weight to the attributes in the white columns (including AC Voltage, Current, Frequency, Height, Length and Width). 👆
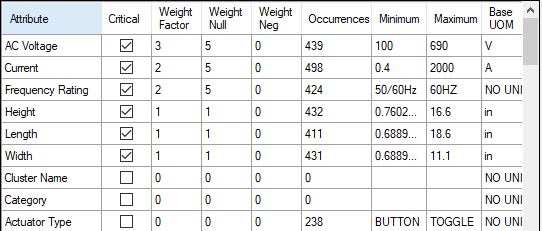
In the chart below, you can observe the weighting factors we used: 👇
- There are about 540 circuit breakers in this batch, so it's good to have at last 400 occurrences for each key attribute to get a true cluster.
- Numeric key attributes are the best for clustering - they make it easy to group very similar parts that have slightly different values.
- If you look back to the chart above, many of the dimensional numeric values are slightly different - they are not exact but very similar.
- As you can see in the chart above, most of the 30 capacitors look similar to the data in the white columns. Now, look at the commercial data in yellow to the right. This data shows you the price of the part, what plant buys the part, and the vendor that provides the part.

Another Example of Cluster Weight Factors
💲 Benefits of Clustering - Price Alignment
...and now for the magic! 💫
In many cases different plants can be buying the same part or a similar part from different suppliers at different prices. It’s recommended taking these clusters to your supply chain organization so they can look at rationalizing the spend globally to achieve better price alignment on the similar parts.
🔎 Identify the Differentiating Characteristic
Another compelling thing clusters expose is which attributes or part characteristics are making the clusters smaller: What are the differentiating characteristics that, if standardize, would result in far fewer parts?
In our experience clustering fasteners for a customer, we noticed that, if you removed length from the cluster, the clusters became big. This customer did a good job standardizing other attributes such as material and finish. When we look at the lengths, however, we noticed many similar lengths were used. It appeared that there were no guidelines or governance processes approving new screws.
The key to successful clustering is identifying the characteristic that is breaking up the large clusters:
- Try zeroing out a single characteristic for a test.
- If the cluster sizes, suddenly jumps up, you found the culprit that is driving proliferation. 👏
📽️ Cluster Video Demonstration
We recommend you check out this video below on how Convergence Data’s clustering process works with our DFR tools. You can see how to find multiple clusters in a single category, and you can see the effects of changing the weighting factors on the cluster sizes:
https://www.youtube.com/watch?v=rneju9QxQfI&feature=youtu.be


