Effective Price Benchmarking
Everyone is trying to determine what competitors are charging for their products through competitive benchmarking but will that really help you make a bigger profit? Maybe, but the real gold is in your existing purchase parts. Use the data you already have in house and compare purchased part costs that your company has incurred over the past two years. This data will allow you to truly increase your profit regardless of  competitor pricing. Price benchmarking looks outward but for optimal profit you must first look inward.
Price benchmarking is considered an important activity to many companies, they want to know how their prices compare to the broader marketplace and closest competitors. Pricing information is more widely available today, through web searches and crawling, but it is tough to stay current. The prices are dynamic, ever changing, and fluctuate by seller, it’s a moving target. In past projects, we have helped clients’ setup benchmarking teardown facilities to make it easier to obtain this competitive data. However, the challenge remains current pricing is fleeting and tools to estimate competitive pricing are hard to find. To provide these capabilities, we partner with Boothroyd Dewhurst and use their DFMA cost estimating tools to help produce accurate should-cost price estimates but before you go to that step look at the data within your company.
Internal cost benchmarking is a process where you would compare the costs you are paying on similar or the same parts across suppliers or even at different purchase quantities. For large organizations, there can be significant savings obtained by rationalizing internal costs across programs for similar high-spend purchased commodities. To do this you can setup a program around direct material parts purchased, parts that go into product bills of materials, that are ordered on a recurring basis to uncover savings. The results will typically identify similar purchased parts with completely different pricing provided by different suppliers. This can be accomplished through analysis of duplicate and near duplicates analytics tools. For optimum results, you need to have cleansed your data and have accurate detailed information on your purchased parts; something most companies typically lack. Having cleansed data, and analytics tools allow companies to find these near duplicate, purchased parts and even of raw materials so they can expose unnecessary pricing variances from different suppliers. Quite often you will notice that the higher volume purchases will have the lower prices compared to the lower volume purchases. Then you must ask yourself, why are we buying in lower volumes when we already have a high-volume priced deal with an existing supplier, for the same part?
Now, how can you determine the potential cost savings of your purchase parts? We would recommend doing what we call a Data Value Analysis (DVA) on a small sample set of commodity parts that you may be purchasing across programs and possible form different suppliers. For example, for those companies whose products have electronics you may want to look at your capacitor spend, a common area of price fluctuation. We have seen cases where just 1,000 cleansed capacitors is enough to run clustering analysis on the data, in this case the cluster revealed a potential savings of $50,000 annually for just one capacitor.
Considering the data in more detail you will see in example 1, below, that the first capacitor has a purchase price of $2.046 per unit which resulted in this case of over $54,000 in annual spend yet the second very similar capacitor is only $0.0905 per unit with a much higher volume of parts. This situation is a great opportunity for spend rationalization.

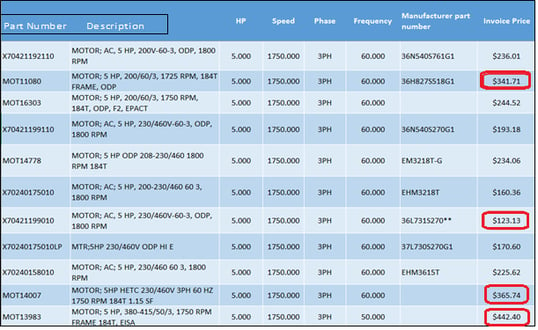
Another DVA was done on motors and similar beneficial results were found. After the data had been cleansed we were able to run a cluster analysis to identify the near duplicate parts to expose extreme pricing differences on motors with similar characteristics. All the motors in Example 2 chart are duplicates based on the attribute profile and some even have duplicate manufacturer part numbers, yet the pricing varies from $123 to $442 per motor.

Many companies are blind to the fact they are buying the same items from different suppliers. It doesn’t make sense to continue to create these duplicated purchased parts, each with a different part number bought from different suppliers. However, if your data quality is poor, this is what can happen. When you cleanse your data – it can unmask this huge issue that can be costing your company millions of dollars in excess direct material spend.
In conclusion, before you start comparing your pricing with your competitors we recommend you do some internal pricing analysis first, get your own house in order. Only after you have done that, should you consider comparing your prices with your competitors. At that time, you are in a much better position to identify real cost comparison results in your marketplace.
About Convergence Data
Companies with chaotic or incomplete data trust Convergence Data to scrub that information into an organized, efficient structure. The company specializes in:
- Minimizing part duplication
- Cultivating part standardization and re-use
- Reducing part count
- Streamlining inventories
- Improving leverage with vendors
- PLM/ERP migrations
Convergence Data enables customers to manage data in a variety of industries, including Aerospace and Defense, Appliances, Automotive, Electronics, Industrial Manufacturing, and Oilfield Services.
For companies deploying PLM or ERP solutions, the cleansing, classification, and data enrichment services from Convergence Data can be a significant benefit.
To learn more about Convergence Data and receive a Data Value Analysis (DVA) go to: www.convergencedata.com.
Image Source: https://www.strategicmanagementinsight.com/tools/benchmarking.html


